If you haven’t seen Informing Equity: Student Need, Spending and Resource Use in Oakland’s Public Schools, you should.
It is a critical first step in understanding what is happening in the difference public education sectors in Oakland and across the range of schools. I will excerpt the reports own big takeaways, but there are two critical ones I want to start with.
The Sectors Need to Talk
First, we need to talk, and share data across public school sectors in Oakland. Charters are more than a bit player—at roughly 30 percent of public school students—and the collection and thoughtful comparison of data is a critical step in understanding better what is actually happening, and then what we can do about it.
This effort to actually share across sectors, conducted jointly by The Oakland Achieves Partnership and Education Resource Strategies, was the most collaborative I’ve seen in Oakland.
I know there are critics to district–charter collaboration, but this should be evidence against that position.
This was the work of the Public Schools Equity Pledge or the Public Pledge or whatever it’s called now in its dormant state. But cutting off lines of communication or collaboration, may draw a line in the sand, but it does not help students, families, or the public to understand what is actually happening. And the average family is much less concerned with the governance model, or charter versus district, than they are with the quality of the school. They want the sectors to talk and to provide better information.
Digging Deeper for Insights
Second, this first round of data really does not answer many questions. It should get us asking them. And I have already heard the back and forth start.
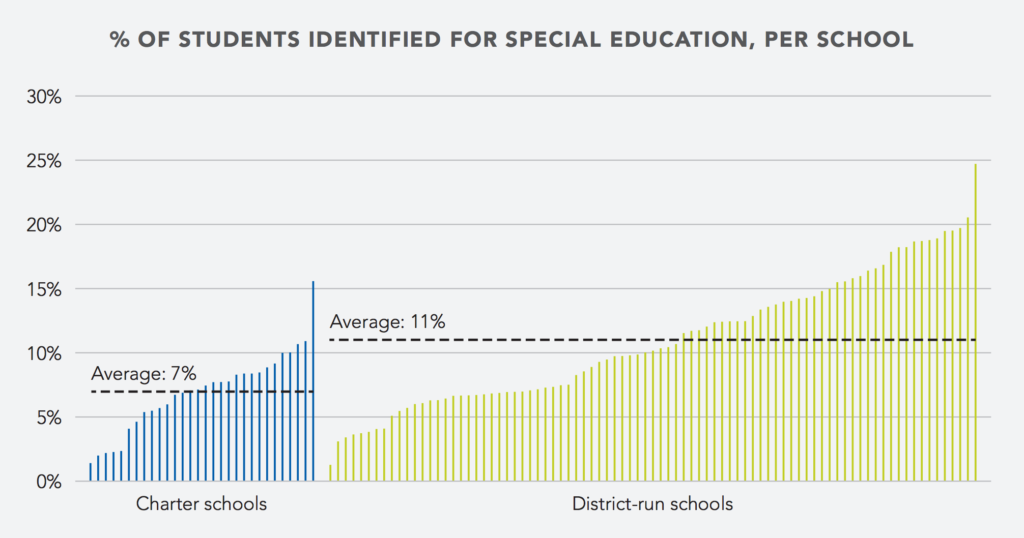
Are the lower special education numbers in some charters because they don’t enroll students or because they serve students well without referring them for special education services or because the district over-refers, and tends to put more children in special day classes? For each area of the report there are arguments for and against, but now at least we are in a position to do the next level of analysis—and start asking the why questions, based on valid data.
And there is extremely wide variation across both public school sectors, with some charters vastly over-representing high needs students and others vastly under-representing, same with the district schools. So the sector generalities really don’t apply to any individual school.
The Report’s Key Findings
The report had three big findings. From the report:
This study examines district-run and charter schools in Oakland across three dimensions: (1) student need, (2) resource levels, and (3) resource use. We analyzed data for the 2014-15 school year from every school run by Oakland Unified School District (OUSD), as well as 32 charter schools, which serve 88 percent of all the charter school students in Oakland. In some cases, we also compared Oakland to a set of peer districts from around California or around the country.
On high-needs students:
Student Need: Overall, the student population in OUSD schools had greater needs than did the Oakland charter school student population. District schools are serving a greater proportion of higher-needs students, in terms of incoming academic proficiency, students in need of special education services, and late entering students.
The report also noted some trends and policy issues that may impact the numbers:
- Compared to peer districts in California and nationally, OUSD places 30 percent more of its special needs students in restrictive environments, which are more costly.
- The state funding law that caps concentration funds for charter schools is resulting in millions of dollars of lost revenue for charters serving high-needs students, making it more challenging for charters to serve them.
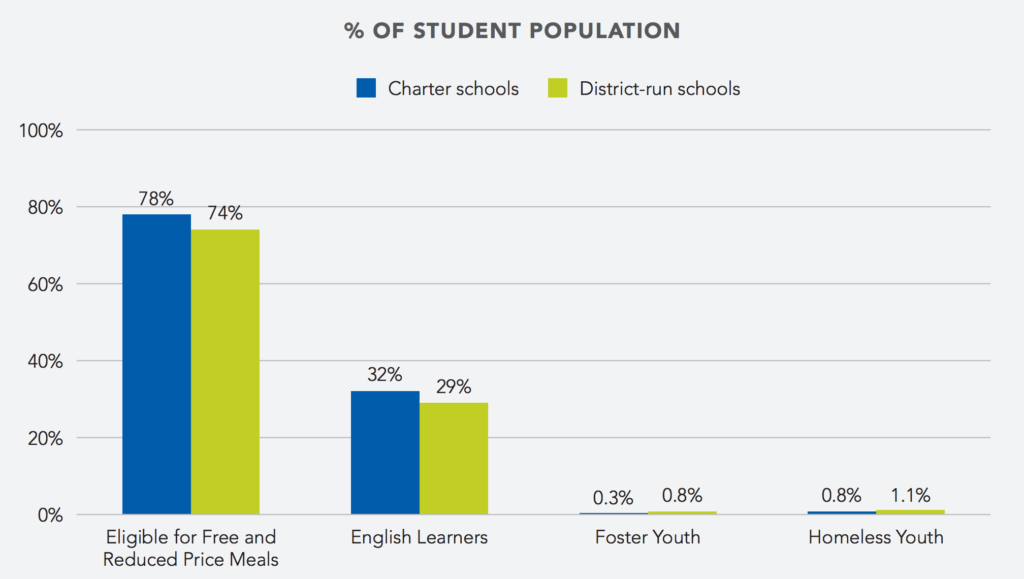
So, while charters do serve more low-income students and English-learners overall, based on the data they do serve less of the highest needs students.
Part of this is a function of charter school lotteries, which take place in spring, and by their nature tend to disadvantage latecomers, who on average, will have higher needs.
But that means that as a sector we need to look at some of our practices and get creative.
Getting Creative on Charter Admissions
Rather than using a ranked waitlist, we could re-lottery a percentage of open seats in the summer, so latecomers would have a fair chance.
And we need to think about how we reach and serve foster and homeless students better. And while the charter school common enrollment system is a step in the right direction, and I know they did lot of outreach, I would love to see Enroll Oakland Charters going out to even more shelters, and partnering with more community advocates, working to extend access to our most challenged families. I’d love for our schools to also develop the specific differentiated supports that some students need.
We also need to look harder at admissions preferences for underserved students. These are actually pretty commonplace in New York, but not so here. Alongside a push to reform the funding formula, this would encourage schools to take those higher-need students and get funding for them.
Resource Levels and Use
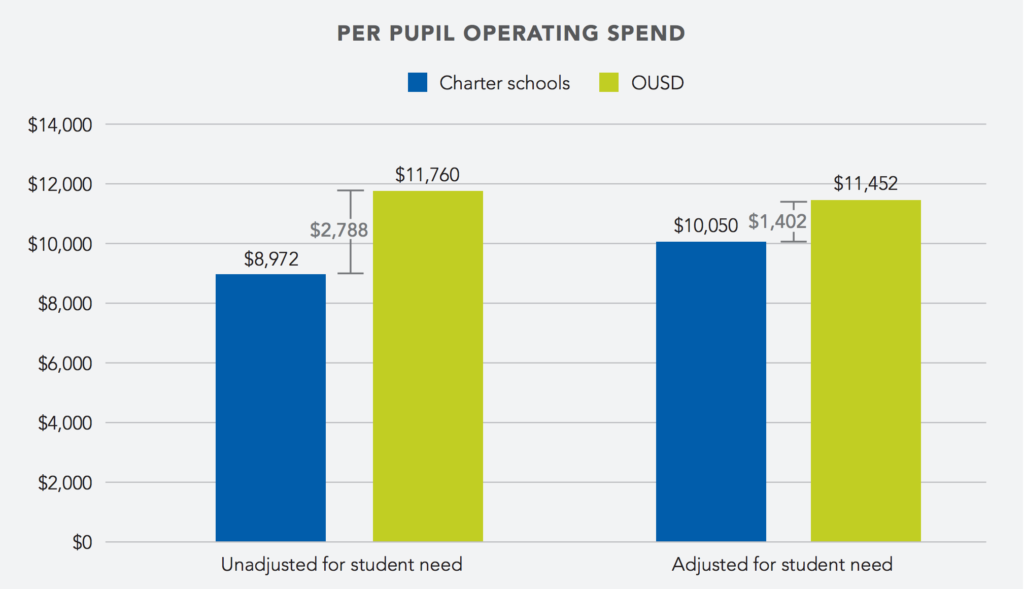
The report also found that charters get significantly fewer resources than district schools, which may surprise some given the rhetoric we hear about rich charter schools.
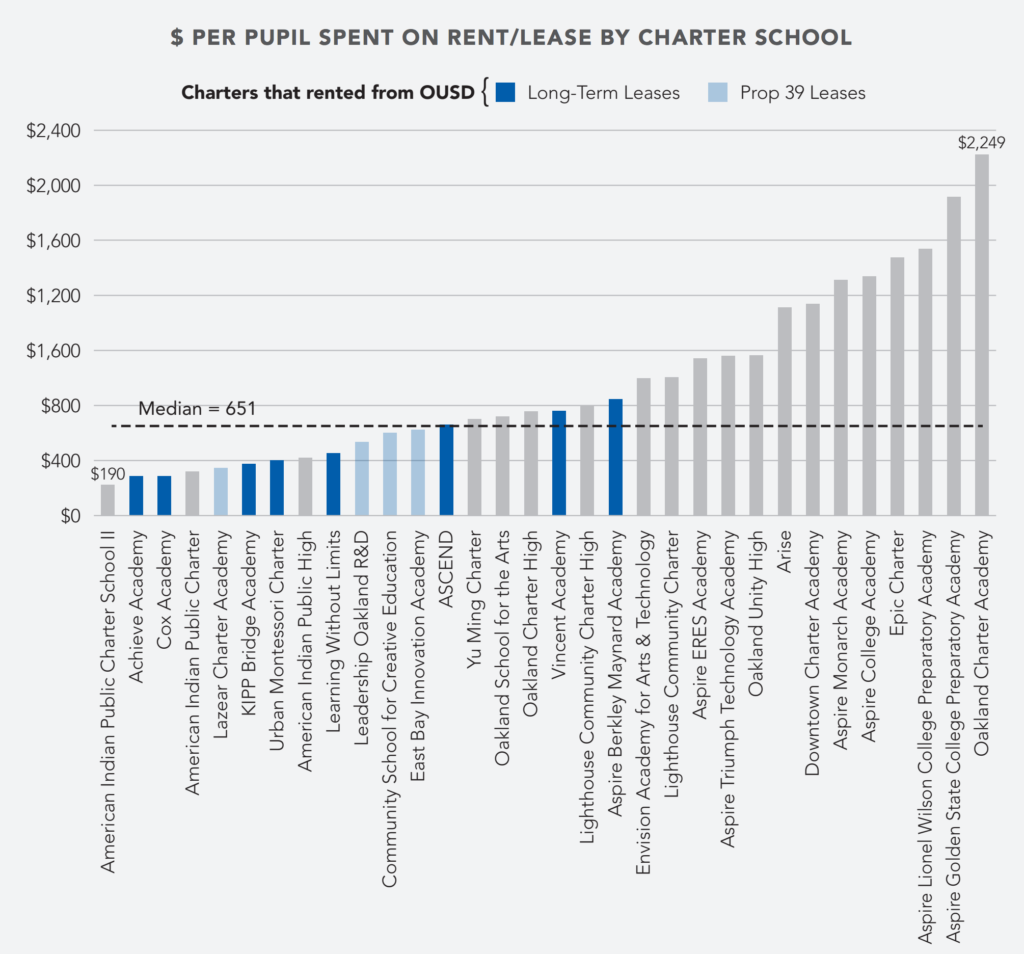
Similarly, when we look at how the money is spent, one glaring issue is the amount of public funding spent on private rents—over $2,000 per child in the most extreme situation.
But in terms of whether the resource disparities are “fair,” we need to look harder at the data and ask some additional questions.
From the report:
Resource Levels: In 2014-2015 OUSD spent $1,400 more per pupil than the average charter school on operating expenses, adjusted for student need differences in special education, English-learner status and eligibility for Free and Reduced Price Meals. This adjustment does not capture other potential differences in student need, such high mobility rates and or the number of students entering school significantly behind academically.
Again, we have some raw data to start with, but not the answers as to whether these disparities in funding may be justified somehow. We need to do that next step of answering the question.
Resource Use and the High Cost of Private Facilities
The most glaring issue here is how much money charters spend on facilities and the wide disparities:
Resource Use: OUSD district-run and charter schools used their resources differently in several important ways…
- Rent for space: Across charters, spending on rent varied from $190 to $2,250 per pupil, with those renting from OUSD generally spending less per pupil than others.
In a state where Proposition 39 gives charters the right to use district facilities, it seems like a waste of resources to pay landlords. Just imagine: that $2,250 per child could make a huge difference if it was invested in instruction.
There will be much more to come in terms of data and analysis, but I hope that this report keeps us talking and asking the right next set of questions based on real data.
That’s what families want, and it’s the only way we will move public education forward in Oakland.

