

I’d highly recommend checking out the Urban Institute’s latest research on the role school attendance boundaries play in school segregation. I’ve captured the Oakland-specific data here and you can see the screenshots below in an online map here.
Here are just a few reminders from the report on the power of attendance boundaries:
“By prioritizing existing boundaries and neighborhoods rather than race, ethnicity, or socioeconomics in zoning criteria, school districts can create attendance boundaries that reinforce segregation patterns.”
“With just small changes to these boundaries, district officials could create more integrated schools and potentially increase opportunities for Black and Hispanic students.”
“By using rezoning to address unequal boundaries, school officials will likely invite negative feedback from families who have grown accustomed to the existing system. But rezoning, whether as part of a larger redesign or for a single school boundary pair, offers school districts an effective tool to address the most unequal boundaries.”
In OUSD, school boundaries appear to be largely static. Most haven’t changed for decades and no regular process (outside of when schools open or close) seems to exist to reevaluate them. A map below, for instance, shows how elementary school boundaries from 15 years ago largely mirror those in place today.
Elementary school boundaries in 2020-2021 (green) overlaid onto those from 2005-2006 (red). Little has changed.

While attendance boundaries haven’t changed since 2005, the city of Oakland certainly has. Approximately, 59% of elementary school attendance areas intersect at least one census tract that is at risk of or in early/ongoing stages of gentrification (see map), according to the Urban Displacement Project.
Providing neighborhood preference without evaluating boundaries to account for demographic shifts will lead to schools that reflect the same level of displacement (see the decline of OUSD’s Black population), exclusivity, and racial isolation as Oakland’s neighborhoods.
As one of the quotes above reminds us, rezoning will always be contentious. Still, mitigating the segregating effect of school boundaries may be easier to achieve than we realize when we look at individual boundaries. At the very least, we need to admit that school boundaries, as designed by the district, play just as significant a role in reinforcing racial segregation as the underlying neighborhoods.
Here are three takeaways from the Urban Institute data.
1. At least 10 school boundaries overlap with at least 75% of a redlining area
One reason Oakland’s neighborhoods are so racially segregated is because of government-sponsored redlining practices at the beginning of the 20th century. Neighborhoods with large shares of Black residents often received the lowest C or D designations and, as a result, received far less investment than other neighborhoods. The economic impact of this practice is still felt today and, regrettably, many attendance areas mirror those redlining maps.
Glenview, Montclair and Joaquin Miller (all no more than around 30% Black or Latino students) share at least 75% of their attendance areas with A or B designations from the HOLC maps.
Alternatively, Greenleaf, New Highland Academy, Rise, Allendale, Manzanita Community, ACORN Woodland, and Encompass (all at least 75% Black or Latino students) share at least 75% of their attendance areas with C or D designations (see map for complete visual).
Elementary school attendance boundaries overlaid on the HOLC redlining map


Redlining practices and neighborhood segregation created (and continue to create) immense economic hardship for Black families in Oakland. Drawing intentionally desegregating school attendance boundaries would be one relatively easy way to ameliorate the effect of those practices and not concentrate wealth or poverty in schools.
2. Inter-district racial differences are the most unequal
Urban Institute defines “racially unequal” boundaries quite strictly, using a number of criteria that includes racial differences between each side of the boundary; between the two attendance areas; and between the school demographics. Using this criteria, no boundaries within OUSD are labeled unequal. Instead, the boundaries that are the most segregating include a neighboring school district, primarily Alameda Unified.
Racially unequal inter-district school boundaries, per Urban’s criteria
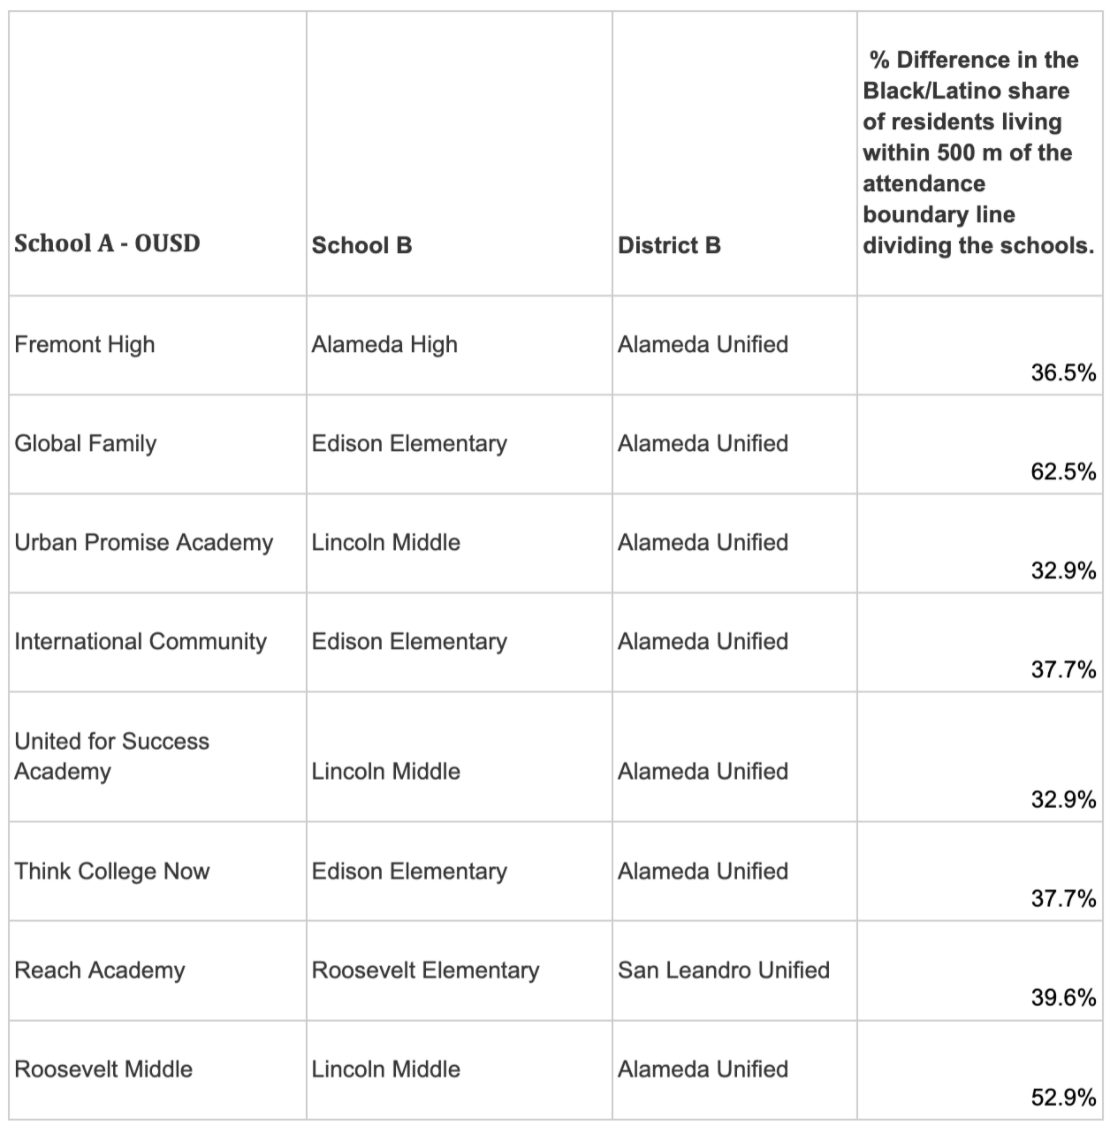
This pattern of the most racially unequal boundaries being between school districts is not unique to Oakland. About 60% of racially unequal school boundaries in Urban’s data set are those between districts. Unfortunately, from a policy perspective, tackling inter-district segregation may be even more challenging than focusing on reform just within Oakland. Still, some districts have given it a go and this data reminds us that regional desegregation efforts could bring about some of the most impactful change.
3. Six boundaries within OUSD are particularly racially unequal
Considering the levels of choice and the variability between in-neighborhood attendance rates in Oakland, we should focus more on the relationship between boundaries and their underlying neighborhoods, rather than school demographics, when evaluating unequal boundaries.
Given that, I adjusted Urban’s criteria slightly to look for at least a 15% difference between: (1) the Black/Latino share of residents living within 500 meters of the boundary line; (2) the Black/Latino share of residents living within the two schools’ entire attendance area; and (3) the White population living within 500 meters of the boundary line.
The boundaries in OUSD that fit this criteria are below ( I omitted a “corner” boundary between Edna Brewer and UFSA/UPA that also fit this criteria in order to focus on more clearly defined attendance boundary lines).
Racially unequal school boundaries within OUSD
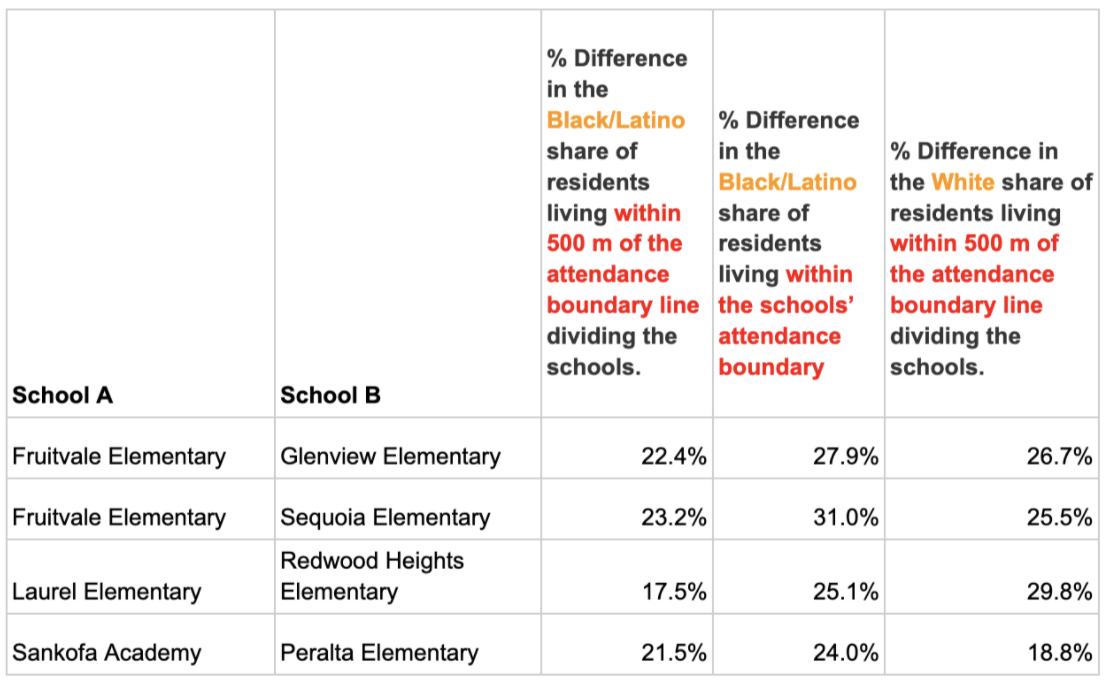
What we find is that the boundaries between Sequoia and Fruitvale, Glenview and Fruitvale, Laurel and Redwood Heights, and Sankofa and Peralta are some of the most racially unequal boundaries in OUSD.
Fruitvale and Sequoia, for instance, have a 31% difference in the share of Black or Latino residents living within the two schools’ attendance boundaries. When visualized below, it’s clear how these types of boundaries could benefit from lines drawn in the opposite direction to their current configuration.
Instead of a horizontal line going East-West between Frutivale and Sequoia, a more integrative approach would be to draw one North-South. A similar approach could be taken for Laurel and Redwood Heights.

The effects of the Sankofa-Peralta boundary are well documented. The difference between the share of Black or Latino residents living within the two attendance areas is about 24%. Interestingly, because of the dynamics of choice and neighborhood preference in Oakland, the difference between the Black or Latino populations in school enrollment is closer to 50%.
One possible remedy is to create something like a zig-zagging East-West line, as shown below. Oakland should even consider merging boundaries (providing equal preference at both schools) when schools are close together and yet their boundaries are so unequal.

The four boundaries above may offer the “lowest hanging fruit” for reform, as Tomás Monarrez, the author of the report, recently explained. Given that they are the worst offenders, adjusting these specific boundaries should perhaps be as high a priority as system-wide reform.
—
Different aspects of OUSD enrollment policy inform school segregation in Oakland; attendance boundaries are certainly only one factor. In many ways, however, when drawn without equity in mind, attendance boundaries can be the most racially exclusionary aspect of the student assignment system. Moreover, when they so closely parallel neighborhood segregation patterns, boundaries are a visible vestige of government sanctioned discrimination
If anything, the data from the Urban Institute shows that we don’t have to think whole scale on boundary reform right away. We can start with specific boundary lines that disproportionately contribute to racial and socioeconomic school segregation. From there, we might begin to realize and build a system that has absolutely no ties to a blatantly racist past.