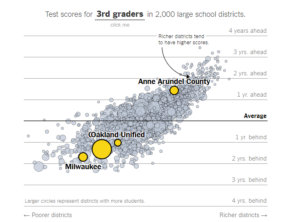
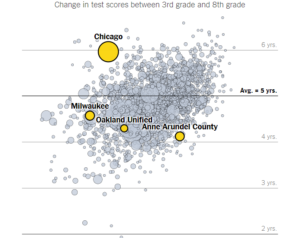
The typical student in Oakland Unified is further behind in 8th grade than they were in 3rd grade that’s according to the latest research from Stanford, covered in a recent NY Times article. You heard that right, the typical student in OUSD progresses 4.3 years academically in the 5 years between 3rd and 8th grade, so while they are roughly a year behind in 3rd grade, they are roughly 2 years behind in 8th grade.
The encouraging thing about the data is that there is such wide variation, even within California. Some districts make more than 5 years growth, others less. So some things are working in some places and some things are not working in others.
Despite the dismal outcomes, there is hope. In Fremont, students gained 5.6 years over the 5 year span, and in Chicago it was 6 years. So poverty is not destiny, but zip codes matter, and so do the decisions of districts.
Let’s look at the study, from the Times
The data, based on some 300 million elementary-school test scores across more than 11,000 school districts, tweaks conventional wisdom in many ways. Some urban and Southern districts are doing better than data typically suggests. Some wealthy ones don’t look that effective. Many poor school systems do.
This picture, and Chicago’s place in it, defy how we typically think about wealth and education in America. It’s true that children in prosperous districts tend to test well, while children in poorer districts on average score lower. But in this analysis, which measures how scores grow as student cohorts move through school, the Stanford researcher Sean Reardon argues that it’s possible to separate some of the advantages of socioeconomics from what’s actually happening in schools.
How is Oakland Doing?
The researchers graphed 11,000 districts based on test score growth and wealth, to give a fairer picture of the district effects. Here is Oakland Unified in 3rd grade
And Oakland Unified in 8th grade
And the comparison of growth
Click around some and look other districts, while Oakland Unified produced 4.3 years of growth in 5 years, West Contra Costa was at 4.6 years, Fresno and Long Beach were at 4.7 years.
And yes this is based on test scores which is an imperfect measure, but try telling that to mom who is seeing her child’s literacy skills decrease (as measured by test scores) compared to peers in nearby districts.
What is lost in the budget crisis?
The school board meetings are rightly spending significant time on the budget. But I am hearing a hardly a peep about how our students are doing, what we are doing to accelerate learning, or develop our programs that are showing real progress.
Our students and families can’t have their academic careers put in a back seat, as the district is consumed with its own messes. We have to be able to walk and chew gum at the same time, which means both addressing our fiscal crisis and our academic crisis, solving either one without the other is a hollow victory.


Prior to explosion of Oakland privately managed charter schools, economically and racially segregated Oakland public schools has had over the years a history of students of relative economic wealth pulling their children out of OUSD when students finished elementary school and not enrolling their students in OUSD middle and high schools.
OUSD School Board’s approval of so man charter schools has increased the segregation of OUSD schools after elementary school. It is not an apple to apple comparison if other districts don’t have a similar economic make-up and opportunity to enroll in non-public school schools as Oakland.
Also, Oakland has the highest percentage of charter schools than any large school district in California. The largest number of privately managed charters is at the middle school level in Oakland. That factor alone makes this type of study of student test score comparisons not an apples to apples comparison.
And, if 5 years of growth is examined in looking at test score comparisons there are technical problems in comparing tests because pen and paper testing has shifted to special kind of computer testing that branches depending on student respond providing more difficult questions based on students answers; and this new untested way of testing over this five year time span further complicates generalizing about comparisons in different districts.
Finally, I agree with Dirk keeping the eye of the District on delivering student achievement, whether measured by standardized testing or not, is important during a financial crisis.. Unfortunately, the previous Superintendent talked a good deal about keeping student achievement foremost, but left the District in financial crisis. School districts need both focus on student achievement and reliable back office management that keeps a district out of financial crisis.
.
I might quibble with some of the specific language you use and i would want to see the data on “segregation” increasing with charters, but those are valid points on the changing student population and opting out, though i wonder whether other districts (like Chicago or Long Beach) have similar patterns. But valid points, and why i argue that we need to track individual kids in Oakland across sector and really see what is happening, appreciate the comments