A Guest post from Jonathon Stewart, who is the Senior Fellow, Oakland CORE Collaborative Project with the Rogers Family Foundation
Measuring both student proficiency, whether students are on grade level, and student growth from year to year matters (read here and here), particularly in places like Oakland where thousands of students enter school each year behind grade level.
Despite the importance of growth, California is one of only two states in the country that does not consider growth when assessing school quality. While researchers push California to consider using growth, districts and organizations participating in the CORE Data Collaborative already have access this valuable data. Moreover, Oakland community members can now view growth data for Oakland’s schools.

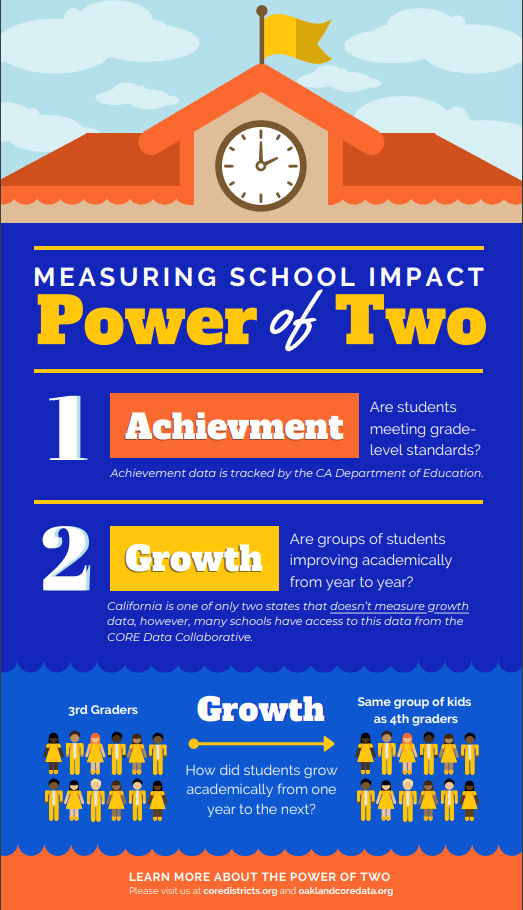
What is Growth?
The growth data from CORE measures how students grow academically relative to students with similar test scores, similar demographics, and similar schools.
CORE Growth data is presented as a percentile from 0 – 100. In the 2018-19 school year, Prescott School achieved 98th percentile growth for Math. That is, Prescott supported their students to grow more, relative to their peers, than 98% of elementary schools in the CORE Data Collaborative. Congratulations to staff and students at Prescott!
| Low Growth | Average Growth | High Growth |
| 0- 29th Percentile | 30th- 69th Percentile | 70th – 100th Percentile |
CORE considers schools at or above the 70th percentile to be high-growth schools. These schools are making a strong contribution to student achievement for their students. These schools are demonstrating consistent work among educators to provide extraordinary classroom instruction for the students they serve.
Why is Growth Important?
The proficiency data show that about two-thirds of Oakland students are below grade-level standards in English and Math. Growth data helps us understand how students are improving academically even if they are not yet meeting grade-level standards.
Schools with multiple years of high growth are having a large impact on student achievement. At these schools, students are consistently making academic gains faster than similar students at similar schools. Since the 2015-16 school year, ASCEND has achieved high growth every year for their elementary students. Congratulations to staff and students at ASCEND!
What are the Limitations of Growth?
First, proficiency is and should be the goal for all kids. Yes, nationally there is a positive correlation between achievement and family income:
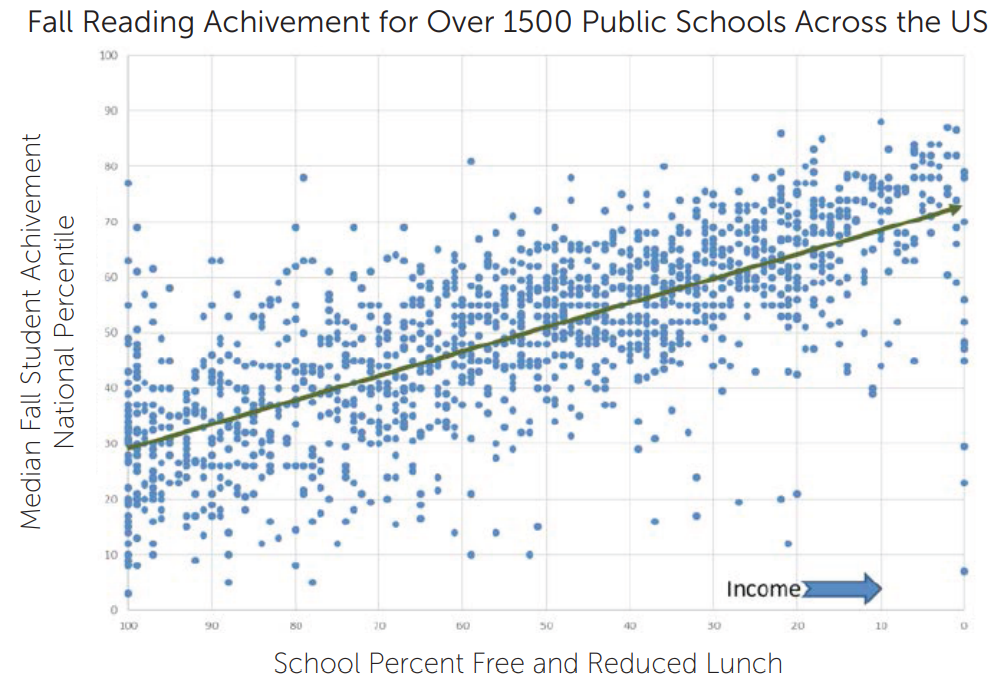
Source: On Growth Models, Time for California to Show Some Improvement
Despite this trend, we must maintain high expectations for our at-promise youth in order for them to thrive in school, career, and community. Growth is not the destination, but it is a necessary step on the path toward proficiency.
Second, growth data is based on performance as measured by standardized tests. So all of the regular disclaimers apply: data is limited to students that complete the test, tests are imperfect measure of a student’s ability, tests are an imperfect measure of a school’s impact, etc.
As such, growth data is just one data point among many – academic proficiency, school climate, school culture, etc. – that we should be using to assess school quality.[6] However with the increasing types of data and places to get information about school quality, the CORE data, often provides more insight into how much schools are actually helping students progress[7] .
So if you are a family looking for a school or know some that are, please share this. And as folks go through the open enrollment process (which already has started and closes in early February) its important that we look at some of the best available data, which is the CORE data, at least around growth.