
The first step to healing is admitting we have a problem. It’s not a district problem, or charter problem, or a private school problem. It’s a problem that underlies our societal fabric, and infects our institutions. And until we step on the scale and look in the mirror, we probably won’t even know the true extent of the problem, much less how to address it.
The State of Black Education in Oakland (SoBEO) developed a report card for OUSD, and the challenge came to the charters to face the music similarly. I hope everyone associated with a school; charter, district, private, or otherwise, will take the 5-10 minutes it takes to get the data together and start their own discussions. Thank you to Dana at the Rogers Foundation, who clarified the data sources and built some tools for us/you. Including the below table of data sources.

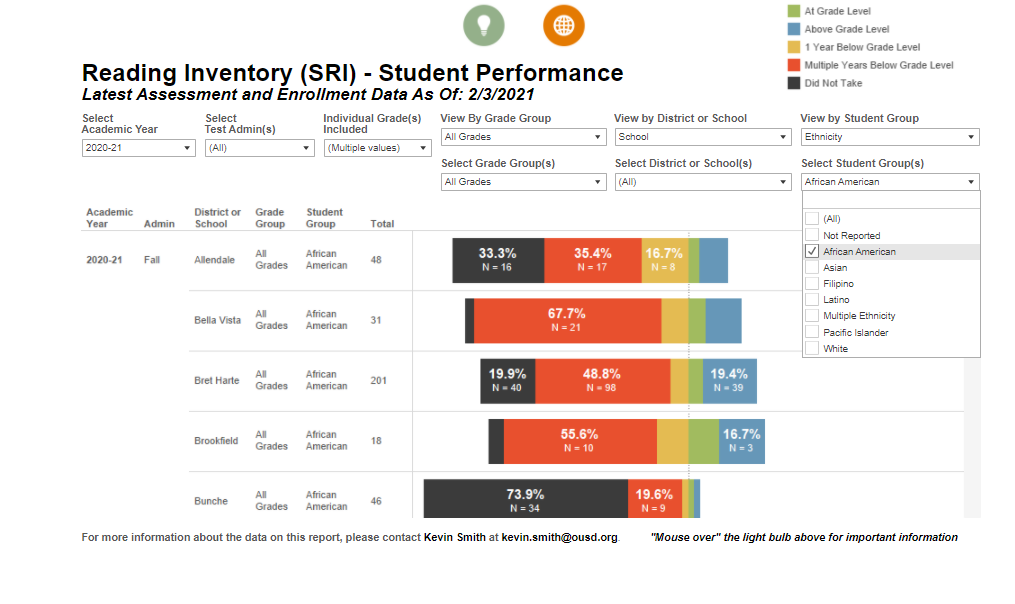
Here’s how you can do it for your school. And please note that the state testing data is 2 years old, which does raise questions. I would still include it, since I don’t think things have really gotten better, but you may also want to look at local tests like the SRI (strategic reading inventory), or there may be other important indicators that we missed or that are particular to your community.
Creating Your SoBEO Report Card
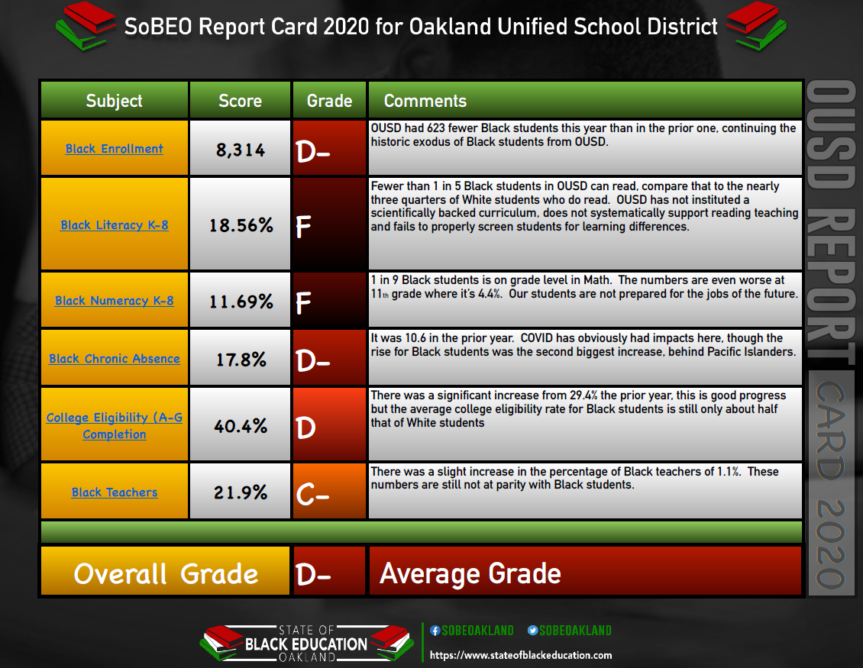
Dana from Rogers put together a more comprehensive look at the data and sources at the end of htis post. And you can see the OUSD report card below as an example. In some places the charter data is with the district schools, in other situations, it’s not and you need to do some navigation.
Much of the data, especially for OUSD schools, is on the dashboard page (this is the main page, I have individual pages linked below) then click the menus. Choose “school” in the “view by district or school” tab, in the “view by student group” tab, pick “ethnicity” and then in the “select student groups” tab, select “African American.” It’s pretty much the same on each of the dashboards.
Some Key Data Points we Used
First, what is the most important data? Some of the key pieces for us are
Enrollment– Is the school gaining or losing Black students, you can look back a couple of years for trends.
Reading and Math on grade level- the percentage of Black students reading on or above grade level on state tests, compare it to some other subgroups. There are a couple of ways to look at this, the Distance from standard, how far are they from grade level? And the overall scores or proficiency rates. Charter data can be found here in the CDE dashboard. The process is a little complicated go to Caschooldashboard.org
- Search for a school- enter the school name (district or charter)
- Click View Additional Reports (near top right)
- Change year to 2019
- Select the right 5×5 report (ex: ELA) and click Submit
- Click View Detailed Data (near the top right)
This will give you a table with most of the data you are looking for
Reading and math growth- the so- called CORE data looks at state tests and compares similar students and their growth, many including myself think this is the best way to look at school data. There is also information on this year’s reading growth in the SRI. Though I think we have to just look twice at current data given some of the issues in administering the assessments.
Black Teachers- Black teachers have a research proven effect on Black student achievement, so we look at the percentage compared to the students or local area, and any change from year to year. I could not find a public data source for this, though school sites should have this information.
Chronic absence– Being chronically absent has a research proven negative effect on achievement, so we look at those rates, compare to other subgroups or overall and see if it is changing over time. Charter reports can be found here.
College eligibility– the percentage of Black students in a cohort who complete the A-G requirements, compared to other subgroups and looking at changes over time
Add your own indicators, and share it with your community and share it with us please. We will share it out, but again, we all need to really look at this data, and in most cases I think that once we do, and the immense human cost that underlies the numbers, that we will get serious about doing something.
Please join us. And we would love to hear about progress reports and effective practices in improving the grades.
SOBEO Report Card Data Sources
Urban Montessori Charter School was the first school to take this on, and when they finalize their report card we will publish it. Will you take on the SoBEO challenge? We would appreciate the opportunity to share your report cards as well.
| Data Point | SOBEO | UMCS | Source: OUSD Schools | OUSD Source Notes | Source: Charter Schools | Chart Source Notes/How to Access the Data |
| Enrollment | ✓ | ✓ | OUSD Data.org – Enrollment | CA School Dashboard | ||
| Distance from Standard – ELA and Math: OUSD Schools | ✓ | OUSD Data.org – SBAC DFS External | Only Includes OUSD schools User need to select the test type Can see a comparison of years for student group | CA School Dashboard | Select 2019 Click on the ELA “Card” Click on View More Details at the bottom of the card Scroll down to Explore Groups by Performance Level Repeat the same steps for math | |
| Percent Proficient – ELA and Math | ✓ | ✓ | OUSD Data.org – SBAC | Only Includes OUSD schools Users need to select the test and the subject Can see a comparison of years for student group | CAASPP | Search for School Name Select the desired year Select the desired Student Group (Ethnicity → Black or African American) Click “Apply Filters” Calculate % Exceed and % Met for ELA and math If you want the Reading Claim: Click on “View Detailed Results” Click on Black or African American Scroll down under the chart to the table and find “Reading: How well do students understand stories and information that they read?” |
| Reading Claim | ✓ | CAASPP | Same as above + If you want the Reading Claim: Click on “View Detailed Results” Click on Black or African American Scroll down under the chart to the table and find “Reading: How well do students understand stories and information that they read?” | |||
| CORE Growth – ELA and Math | OUSD Data.org – CORE Growth | Includes ALL participating public schools Users need to select the subject | OUSD Data.org – CORE Growth | |||
| Chronic Absence | ✓ | ✓ | OUSD Data.org – Chronic Absence | Only Includes OUSD schools Can see a comparison of years for student group | DataQuest | Level = School Subject = Absenteeism Data Select “Submit” Select Desired School Year Type part of name of school in box Select school name Select Report: Chronic Absenteeism Rate Select “Submit” Table will display by Ethnicity |
| A-G Completion | ✓ | N/A | OUSD Data.org – A-G Completion | Only Includes OUSD schools Can see a comparison of years for student group | DataQuest | Level = School Subject = Four-Year Cohort Graduation Rates & OutcomesSelect “Submit” Select Desired School Year Type part of name of school in box Select school name Select Report: Four-Year Cohort Graduation Rates Table will display by Ethnicity To calculate the A-G rate, divide the number of Graduate Meeting UC/CSU Requirements by the number of Regular HS Diploma Graduates |
| Teachers | ✓ | ✓ |