

Where you send your child to school is one of the most important decisions you can make. The new school quality data was released by the state recently, and I wanted to highlight some of the schools making progress with Oakland children, and encourage families to visit. Every child is different, and I will break it down into subgroups (schools showing progress with Black, Brown and low income students) in the next few weeks and you can also take a look at the schoolfinder tool to find local schools.
But before I get to the public schools showing the most progress, and those having the highest scores, let me give a warning. These numbers may be imperfect, and no number can capture a school, or the variation within it. So please take these lists as starting points and do your homework. I have written before about the perils of using tests exclusively to judge schools.
It is also critical to look at mix between how well students at a school are doing (overall performance) combined with how much progress students are making (growth from year to year). And the nature of testing is that it is harder to make large gains when a school is already high performing, and “easier” when a school is low performing.
Digging into the new data
Everything I am showing here is publicly available on the OUSD website, though you need to poke around some. And now is the time to research and apply to schools in open enrollment. We have never had more options, easier ways to enroll, or more information about schools, so we need make the best choices we can. Families should also take a look at the Oakland school finder.
K-8 Schools where students made the most gains
You can view all the K-8 school results here. But let’s dig in a little. Community School for Creative Education made massive gains in ELA and Lighthouse Lodestar did in math, Lazear made significant increases in both, as did Melrose, while Yu Ming stood out for having significant increases and also being an overall high performing school. But congratulations to all the schools making progress and I hope families will take a hard look and apply to schools that fit.
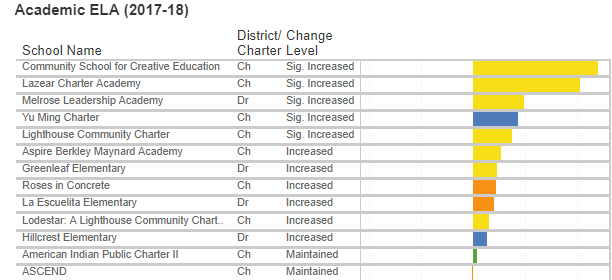
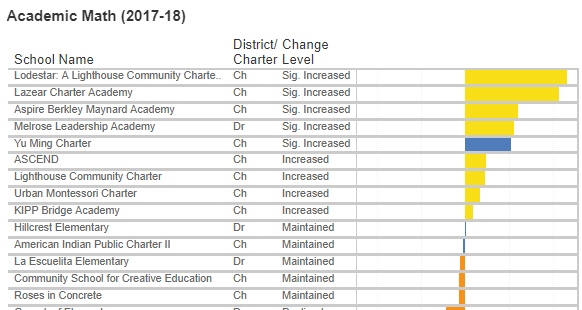
Note that gray lines mean that less than 30 students were tested, and the other colors relate to how high the average scores were. The five color-coded performance levels in order are: blue (highest performance),green, yellow, orange, and red (lowest performance).
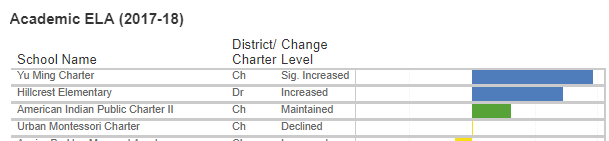
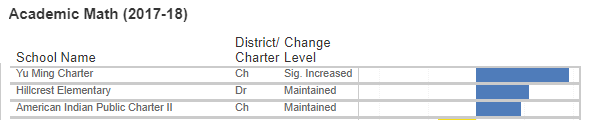
K-8 Schools that had the highest performance
The list of schools that are above the state average is relatively small in Oakland, but you can see the schools below, with Yu Ming, Hillcrest and American Indian II as the only schools above the average on both math and ELA.
The previous list of middle schools to consider is here.
Knowledge is power
So please, take advantage of your options and the information at your disposal. There are enrollment fairs coming up from OUSD and Enroll Oakland over the next several weeks. Your children are counting on you to do the best by them, and that starts with making informed choices.
Let me know if I can help, and I will be doing future posting on middles and high schools, as well as subgroups.
You have the tools, now use them.
If you want more information like this, please follow me on facebook, twitter or the blog