
“Over time, reading outcomes have changed little for Black and Brown students.”
This is a line from a recent report on Oakland student performance data by Families in Action for Quality Education (FIA). Those outcomes are incredibly low: just 2 out 10 Black and Brown students in Oakland public schools can read at grade level. Pause on that for a moment. In a classroom with 20 Black and Brown students, only 4 read on grade level. At the bottom, with the lowest performance, are Black students. Yet, Black and Brown students account for 69% of Oakland public school students.
Here’s a graph taken from the report, we break down the data into a table below:

Here’s that information in table:
| 2014-15 | 2015-16 | 2016-17 | 2017-18 | 2018-19 | 2021-22 | |
| White | 63% | 67% | 73% | 75% | 70% | 70% |
| Asian | 53% | 52% | 55% | 57% | 51% | 57% |
| Latinx | 23% | 25% | 27% | 29% | 28% | 26% |
| Black | 19% | 20% | 21% | 22% | 22% | 22% |
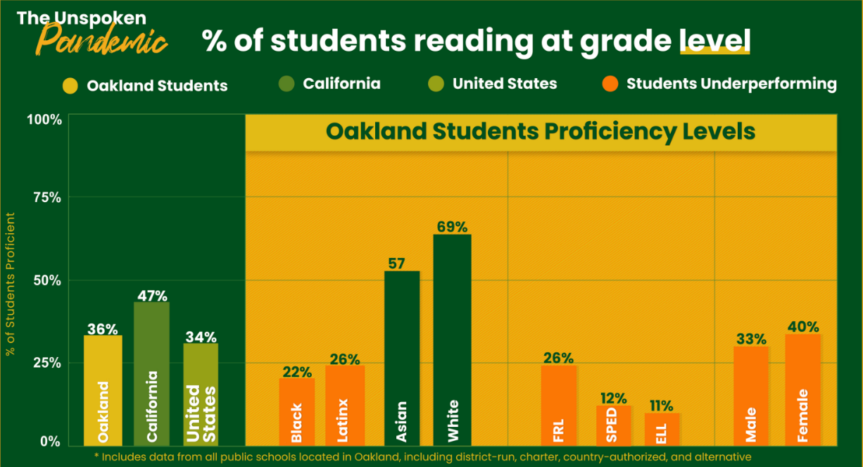
How do Oakland students compare with other California students?
The data comparing Oakland with California doesn’t get any better: the Town lags behind the state for all students. Forty-seven percent (47%) of students across the state are proficient in reading but just 36% of Oakland students are. When we focus on data for Black and Brown students we see similar gaps. Across the state, 36% of Black and Brown students are proficient in reading compared to 25% of Black and Brown Oakland students. Other subgroups in Oakland perform well below the state average for all students (47%) including students who receive free or reduced price lunch (26%); Special Education students (12%) and English Language Learner students (11%). Here’s the data from the FIA report. Note the orange bars showing students who are underperforming:

Are any Oakland schools higher than the state average for Black and Brown student performance?
The data had us asking another question: what Oakland public schools are matching or exceeding the state benchmark of 47% – but for Black and Brown students? It’s not an apples-to-apples comparison as the state is measuring all students and for this exercise we’ll just be looking at Black and Brown students in Oakland. We are analyzing 2022 SBAC English Language Arts (ELA) proficiency data and referencing the California School Dashboard for demographic data (Schools are listed in alphabetical order).
Here are the schools with Black Student ELA proficiency levels over the state average
| School Name | Black Student ELA | Black Student Population % |
| AIMS College Prep Elementary | 55% | 40.6% |
| Cleveland Elementary | 56% | 15.2% |
| Downtown Charter Academy | 82% | 4.1% |
| Francophone Charter | 48% | 16.5% |
| Hillcrest Elementary | 47% | 7.3% |
| Lincoln Elementary | 56% | 8% |
| Thornhill Elementary | 62% | 8.7% |
| Yu Ming Charter | 72% | 8.2% |
Reflections on the data
- There are 135 Oakland public schools yet only 8 made this list (four district schools, four charter schools).
- AIMS Elementary is the only school on the list with a Black student population above 20 percent
- The top two schools on this list, Downtown Charter Academy (82 percent) and Yu Ming Charter (72 percent) each have Black student populations under 10 percent.
Here are the schools with Latinx Student ELA proficiency levels over the state average
| School Name | Latinx Student ELA | Latinx Student Population % |
| AIMS College Prep Elementary | 48% | 9.6% |
| AIMS College Prep Middle | 48% | 11.5% |
| Chabot Elementary | 73% | 13.4% |
| Claremont Middle | 60% | 17.1% |
| Cleveland Elementary | 52% | 18% |
| Crocker Highlands Elementary | 65% | 14.5% |
| Downtown Charter Academy | 49% | 14.8% |
| Francophone Charter | 55% | 23.4% |
| Glenview Elementary | 50% | 15.7% |
| Hillcrest Elementary | 67% | 7.1% |
| Joaquin Miller Elementary | 56% | 20.3% |
| Lincoln Elementary | 50% | 4.9% |
| Montclair Elementary | 63% | 15.4% |
| Oakland Charter High | 60% | 58.1% |
| Oakland Tech High | 56% | 20.1% |
| Oakland Unity Middle | 61% | 85.2% |
| Peralta Elementary | 65% | 12.7% |
| Redwood Heights Elementary | 55% | 17.6% |
| Sequoia Elementary | 61% | 24.2% |
| Thornhill Elementary | 59% | 16.1% |
| Yu Ming Charter | 94% | 8.5% |
Reflections on the data
- Two schools with a Latinx student population above 50 percent also have high Latinx ELA scores: Oakland Charter High (60% ELA) and Oakland Unity Middle (ELA 61%).
- While this list is longer than the list for Black students (21 schools vs. 8 schools), there are few schools (6 total) with a percentage of Latinx students above 20% and an ELA percentage: Francophone Charter, Joaquin Miller Elementary, Oakland Charter High, Oakland Tech, Oakland Unity Middle and Sequoia Elementary.
Why aren’t proficiency rates for Black and Brown students high at all schools?
The fact is that the schools above are beating the proficiency rates for all students in California, and they are well above what we see across Oakland schools enrolling Black and Brown students. Why don’t all Oakland public schools enrolling Black and Brown students have proficiency rates this high? What are the factors that contribute to these higher proficiency rates? What do families, teachers, and school leaders think contributes to the higher rates?These numbers can be overwhelming and confusing, but they’re simply not good enough. And while these schools deserve applause for their work to support Black and Brown students to read at grade level, we can’t let a few bright spots distract us from the glaring fact that everyday too many of Black and Brown students continue to read below their grade level. Check out the FIA report on its website, fiaoakland.org, where you can read the report and learn more about FIA’s Raising the Bar campaign.