
Where you send your child to school is one of the most important decisions you can make. We haven’t had new school quality data from the state due to distance learning, so the data is from the 2018-19 school year and I wanted to highlight some of the schools making progress with Oakland children, and encourage families to visit. Every child is different, and I will break it down into subgroups (schools showing progress with Black, Brown and low income students) in the next few weeks and highlight these schools that have open seats for next school year. You can also take a look at the schoolfinder tool to find local schools.
In this blog, we’ll be looking at some different data sources to give us a more comprehensive look at how Oakland high schools are serving African American students: graduation rates and A-G completion rates.
The Oakland public high schools with the highest A-G completion rates for African American students are: American Indian Public High (100%); BayTech (100%); Envision (100%); MetWest (91%). Completing the A-G courses is important because it qualifies a student for the UC or CSU system. If they don’t complete the A-G they cannot even apply to many schools.
The Oakland public high schools with the highest graduation rates for African American students are: Oakland School for the Arts (100%); McClymonds (93%); OMI (93%); American Indian Public High (91%); Oakland High (90%); Oakland Tech (90%).
Round one of applications has passed but you can still apply for round 2 and many schools still have seats, or will, as waitlists clear. If you are looking for a school for next school year, or the current school year, you can find more information and fill out an application here. Applications now are placed on a waiting list at each of your selected schools, and/or you’ll be offered enrollment if space becomes available. In our “Open Seats” blogs, we’ll also let you know if any charter schools showing average or above average growth currently have open seats (OUSD does not share that data though we would happily share it if they did). Here are our most recent open seats blogs: find out more about high-performing schools with seats for this year here and next school year (2021-2022) here.
But before I get to all the public schools serving African American high school students, let me give a warning. These numbers may be imperfect. The numbers don’t reflect if more high needs students came into a school, and no number can capture a school, or the variation within it. So please take these lists as starting points and do your homework. I have written before about the perils of using tests exclusively to judge schools. I include data on graduation rates, change (how much scores went up or down from year to year) and status (overall scores), which together provide a more balanced look at school quality.
Digging into the Data
The data source for the graduation rate and A-G completion data here is from the California Department of Education and analyzed by Dana Wellhausen of the Rogers Family Foundation (thanks Dana).
Different schools often produce different results with different students so I will also produce blogs looking at schools showing results for Black, Latinx, API and other subgroups. So keep tuned. The results I analyze here are for African American High school students.
Here are the results for: African American middle school students; Latinx middle school students; African American elementary school students and Latinx elementary school students.
You can view all the school results here.
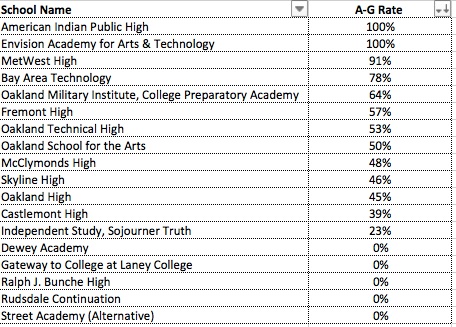
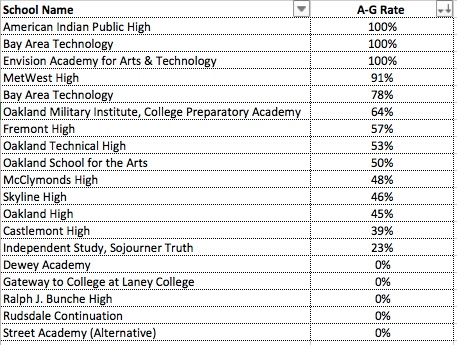
Here are the A-G completion rates for African American high school students:
American Indian Public High (100%); Envision (100%); MetWest (91%); BayTech (78%); OMI (64%); Fremont (57%); Oakland Tech (53%); Oakland School for the Arts (50%); McClymonds (48%); Skyline (46%); Oakland High (45%); Castlemont High (39%); Sojourner Truth (23%); Dewey (0%); Gateway to Laney (0%); Bunche (0%); Rudsdale (0%); Street Academy (0%). Note that some of the schools with very low rates are alternative schools.
Here is what the data looks like for African American high school students A-G completion:
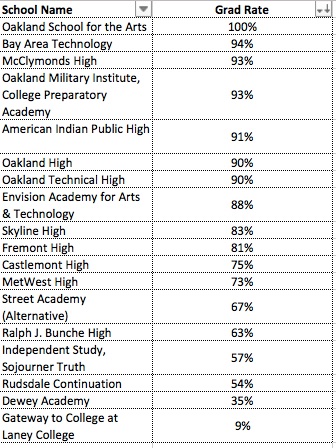
Here are the graduation rates for African American high school students:
Oakland School for the Arts (100%); BayTech (94%); McClymonds (93%); OMI (93%); American Indian Public High (91%); Oakland High (90%); Oakland Tech (90%); Envision (88%); Fremont (81%); Ralph Bunche (63%); Castlemont (75%); MetWest (73%); Street Academy (67%); Sojourner Truth (57%); Rudsdale (54%); Dewey Academy (35%); Gateway to Laney (9%).
Here is what the graduation data looks like for African American high school students:
Knowledge is power
Please, take advantage of your options and the information at your disposal. There are enrollment portals for OUSD and Enroll Oakland and the window for round2 is open now, so get your applications in. Your children are counting on you to do the best by them, and that starts with making informed choices.
Let me know if I can help, and I will be doing future posting on middles and high schools, as well as subgroups.
You have the tools, now use them.If you want more information like this, please follow me on facebook, twitter or the blog.